

Melbourne Pollen Count
AirHealth Pty Ltd · Weather
Independent analytics for this App Store listing. AppTracker is not affiliated with AirHealth Pty Ltd.
Chart standing · US
What changed · US
Listing changes AppTracker has observed for this app in this storefront — new versions, price moves, rating shifts, and store copy.
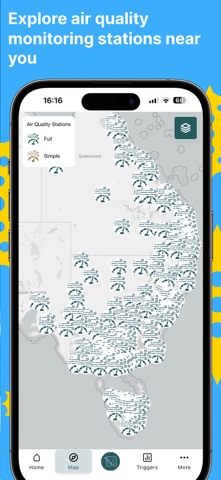
This update makes symptom logging faster, map insights clearer, and sharing more convenient. A clearer map • Report markers now cluster automatically, reducing overlap at lower zoom levels. • The timeline starts collapsed and expands when playback begins. • Tap a group of symptom reports to view the severity distribution and switch between Time, Age and Gender breakdowns. Faster daily check-ins • Dashboard and Me now include a simple smiley check-in for recording how you feel. A brief acknowledgment is shown the first time you use it. • With location enabled, your check-in is saved immediately, with options to undo or continue adding details. Without location, your selection is not saved until you continue and complete the log. • Your Dashboard selection carries over to Me, resumes after the smiley question, and tracks daily completion separately for each profile. • A new floating shortcut and one-question-at-a-time flow make full reports easier to complete. Easier sharing • Share tiles directly from More. • After taking a screenshot on Dashboard or a Measure detail screen, you can choose to create a share card. A refreshed Me and Communities • Me is now focused on your personal symptoms. Review your history and compare it with averages for your selected location, with a layer selector for different comparisons. • Communities brings community news and updates together in one place. More improvements • Added support for iOS Home Screen widgets. • Improved loading states, layout and overall stability across Dashboard and Measure details.
Price & rating history · US
Reconstructed from the listing changes AppTracker has observed in this storefront. A field is charted once it has changed more than once, and each line starts at the value it moved from.
Average rating · ★ 4.50 now · 2 changes on record
Ratings breakdown · US
The star breakdown behind this app's rating in this storefront.
In-app purchases · US
What this app sells inside itself, grouped by kind and priced for this storefront.
Screenshots


About
The Melbourne Pollen App provides Victorians with pollen forecasts generated using real-world pollen count data collected from our statewide network of monitoring sites. You can use the Melbourne Pollen App to track your hay fever symptoms to figure out which pollen types are triggering your symptoms. Our notification system can alert you when grass pollen levels in your area are high, helping you plan your activities. Since the November 2016 thunderstorm asthma event, Melbourne Pollen has worked closely with the Victorian Department of Health and Bureau of Meteorology to develop and implement a Thunderstorm Asthma forecast system to minimize the impact that any future epidemic thunderstorm asthma events may have on the community and the Victorian health system. Our notification system can alert you to forecasts of thunderstorm asthma in your area. Key Features: Accurate Pollen Forecasts: Get reliable predictions for a variety of pollen types, enabling you to identify and manage your hay fever triggers effectively. Proactive Notifications: Receive timely alerts when grass pollen levels spike in your area, allowing you to plan your activities with confidence. Thunderstorm Asthma Forecasts: Developed in collaboration with health authorities, the Thunderstorm Asthma forecast system helps protect the community and health system from potential future epidemics. Contribute to Research: By participating in our surveys, you play a crucial role in advancing our understanding of pollen's impact on health, ultimately benefiting the wider community. Comprehensive Allergy Management: From pollen counts to Thunderstorm Asthma alerts, we provide a complete suite of tools to help you navigate allergy season. Don't let allergies hold you back! Download the Melbourne Pollen Count and Forecast App today and reclaim control of your well-being. Your comfort is our top priority! Together, let's create a healthier, more informed community. Melbourne Pollen also conducts research aimed at better understanding the health impacts of the different types of pollen in our air. Completing the survey regularly helps us with this important work. Terms of Use (EULA): https://www.apple.com/legal/internet-services/itunes/dev/stdeula/
What's new · 3.0.2
This update makes symptom logging faster, map insights clearer, and sharing more convenient. A clearer map • Report markers now cluster automatically, reducing overlap at lower zoom levels. • The timeline starts collapsed and expands when playback begins. • Tap a group of symptom reports to view the severity distribution and switch between Time, Age and Gender breakdowns. Faster daily check-ins • Dashboard and Me now include a simple smiley check-in for recording how you feel. A brief acknowledgment is shown the first time you use it. • With location enabled, your check-in is saved immediately, with options to undo or continue adding details. Without location, your selection is not saved until you continue and complete the log. • Your Dashboard selection carries over to Me, resumes after the smiley question, and tracks daily completion separately for each profile. • A new floating shortcut and one-question-at-a-time flow make full reports easier to complete. Easier sharing • Share tiles directly from More. • After taking a screenshot on Dashboard or a Measure detail screen, you can choose to create a share card. A refreshed Me and Communities • Me is now focused on your personal symptoms. Review your history and compare it with averages for your selected location, with a layer selector for different comparisons. • Communities brings community news and updates together in one place. More improvements • Added support for iOS Home Screen widgets. • Improved loading states, layout and overall stability across Dashboard and Measure details.
Details