

Chart Lens - AI Chart Reading
Cheol Kim · Finance
Independent analytics for this App Store listing. AppTracker is not affiliated with Cheol Kim.
Chart standing · US
What changed · US
Listing changes AppTracker has observed for this app in this storefront — new versions, price moves, rating shifts, and store copy.
Chart Lens Pro is here. Keep analyzing charts without limits after your 3 free analyses. · Monthly and yearly plans (yearly includes a 3-day free trial) · Stronger market verification — the verified mark appears only when the instrument is confirmed, and unconfirmed data is left out of the report. · Re-check with today's prices — bring a saved report up to date against today's market data. · See how a signal was built — open the rules and measurements behind each score.
In-app purchases · US
No in-app purchases.
Screenshots


About
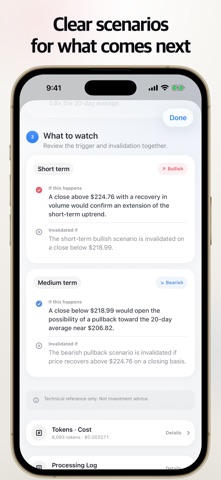
One chart screenshot is all it takes. Chart Lens identifies the instrument, checks its price history and indicators, and sums up what the chart is showing right now. [ How it works ] 1. Pick a chart image from your photo library. 2. AI reads the instrument, market, and chart structure. 3. Your device fetches a year of price data and computes indicators. 4. The reading and the computed values are combined into one report. [ What the report covers ] · Instrument and current signal · A price & volume chart drawn from real market data · Key price levels such as support and resistance · Upside and downside scenarios with invalidation conditions [ The report screen ] Support and resistance lines are drawn over a price & volume chart built from real market data, alongside signal scores for trend, momentum, and participation, evidence statements, and response scenarios — all on one screen. When market data is verified, the signal and score are fixed by on-device rules, not by the AI. [ Indicators are computed on device ] 52-week high and low, period return, SMA 5/20/60, RSI 14, MACD, ATR 14, Bollinger Bands 20, and 20-bar average volume are calculated by the app itself, so no number is invented that isn't grounded in real data. [ Please read ] Chart Lens is a technical analysis reference tool, not investment advice. Scores shown are rule-based signal strength, not probabilities or expected returns. Past data and indicators do not guarantee future results. You are solely responsible for your own investment decisions and their outcomes. Available in English, Korean, and Japanese. [ Chart Lens Pro ] Every user gets 3 free chart analyses. Chart Lens Pro removes that limit - unlimited chart analyses, nothing else is gated. - Chart Lens Pro Yearly: US$22.99 per year, including a 3-day free trial - Chart Lens Pro Monthly: US$2.99 per month Prices vary by region and the exact amount is shown before you confirm the purchase. Payment is charged to your Apple Account at confirmation. The subscription renews automatically unless it is cancelled at least 24 hours before the end of the current period, and your account is charged for renewal within 24 hours before the period ends. You can manage or cancel your subscription in your Apple Account settings after purchase. Any unused portion of a free trial is forfeited when you buy a subscription. Terms of Use: https://factual-verbena-760.notion.site/Terms-of-Use-BabyWaa-77b803b0a33f46868632534bcb469e3c Privacy Policy: https://factual-verbena-760.notion.site/Privacy-Policy-BabyWaa-dbbc3cae71b541caa9712caeeb1d7251
What's new · 1.2
Chart Lens Pro is here. Keep analyzing charts without limits after your 3 free analyses. · Monthly and yearly plans (yearly includes a 3-day free trial) · Stronger market verification — the verified mark appears only when the instrument is confirmed, and unconfirmed data is left out of the report. · Re-check with today's prices — bring a saved report up to date against today's market data. · See how a signal was built — open the rules and measurements behind each score.
Details