

TRTT: Statistics & .sav Data
Rafal Rybnik · Business
Independent analytics for this App Store listing. AppTracker is not affiliated with Rafal Rybnik.
Chart standing · US
What changed · US
Listing changes AppTracker has observed for this app in this storefront — new versions, price moves, rating shifts, and store copy.
SYNTAX FILES - Open .sps syntax files from Files or with File ▸ Open Syntax… They load into the Syntax editor and run only when you tap Run, just as in SPSS. - Apply the labels exported by survey platforms: variable and value labels, formats and ALTER TYPE. - Every command that fails is listed with its line number, and the rest of the file still runs. - Save your syntax as a .sps file. CHART BUILDER - New charts: simple and stacked area, dual Y axes, stacked histogram, frequency polygon and summary point plot. - Panels: split bar, line, histogram and scatter charts into rows and columns. TABLES AND DATA - Tables with several row variables now lay out, copy and export correctly. - Explore: choose the confidence level for the mean. - Utilities ▸ Variables… shows the full dictionary and jumps straight to a variable. - Data View shows numbers the way SPSS does. FIXES - More reliable opening and saving of files, and returning to the app from the background.
Screenshots



About
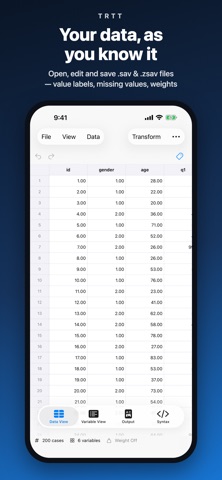
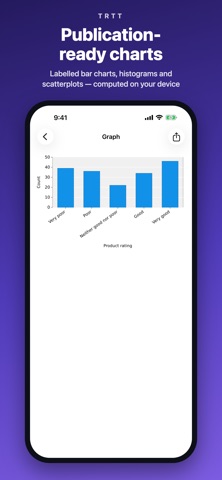
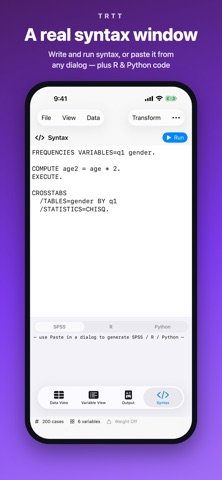
TRTT is a complete statistical analysis tool that runs entirely on your device. Open, edit and save .sav and .zsav data files (the format used by IBM SPSS Statistics), import CSV and Excel workbooks, run the analyses you know, and share publication-ready output. FREE — WITH EVERY FEATURE Every analysis, every chart, the data editor and the syntax editor are free to use with datasets of up to 100 cases. Nothing is held back behind a feature list. Open a larger file and TRTT offers you a choice: load its first 100 cases and carry on for free, or unlock full dataset size. TRTT PRO (IN-APP PURCHASE) TRTT Pro is an optional in-app purchase and it unlocks one thing: dataset size. With it you work on files of any length, from a 500-case survey to a full register extract. Choose a weekly or a monthly subscription, or buy the lifetime unlock once and keep it (lifetime includes Family Sharing). Everything else is already in the free version, and stays there. ANALYSES Frequencies, Descriptives, Explore, Means, Crosstabs with chi-square, Ratio Statistics, correlations, t-tests, One-Way ANOVA and Univariate GLM, linear and ordinal regression, factor analysis, K-Means, hierarchical and TwoStep clustering, discriminant analysis, Nearest Neighbor classification and nonparametric tests — with weighted data, Select Cases and Split File, exactly as in desktop statistics packages. CHARTS Chart Builder with bar, line, pie, histogram, scatter, boxplot, error-bar and high-low charts, plus confidence intervals on bars and lines. DATA MANAGEMENT Data View and Variable View with value labels, missing values, variable types and formats. Compute, Recode, Rank Cases, Count Values, Autorecode and more — every transformation from the dialogs can also be pasted as authentic syntax. SYNTAX A real syntax editor: write and run SPSS-style commands, or use Paste in any dialog to generate the equivalent SPSS, R or Python code. OUTPUT YOU CAN HAND IN Tables and charts you can export as PDF, or as a native .spv viewer file. YOUR DATA STAYS YOURS 100% offline. No account, no cloud, no tracking — your data files never leave your device. Compatible with .sav/.zsav files created by IBM SPSS Statistics, PSPP and other statistical software. TRTT is an independent product and is not affiliated with or endorsed by IBM. Terms of Use: https://www.apple.com/legal/internet-services/itunes/dev/stdeula/ Privacy Policy: https://trtt.app/privacy.html
What's new · 1.3.0
SYNTAX FILES - Open .sps syntax files from Files or with File ▸ Open Syntax… They load into the Syntax editor and run only when you tap Run, just as in SPSS. - Apply the labels exported by survey platforms: variable and value labels, formats and ALTER TYPE. - Every command that fails is listed with its line number, and the rest of the file still runs. - Save your syntax as a .sps file. CHART BUILDER - New charts: simple and stacked area, dual Y axes, stacked histogram, frequency polygon and summary point plot. - Panels: split bar, line, histogram and scatter charts into rows and columns. TABLES AND DATA - Tables with several row variables now lay out, copy and export correctly. - Explore: choose the confidence level for the mean. - Utilities ▸ Variables… shows the full dictionary and jumps straight to a variable. - Data View shows numbers the way SPSS does. FIXES - More reliable opening and saving of files, and returning to the app from the background.
Details