
Chart standing · US
What changed · US
Listing changes AppTracker has observed for this app in this storefront — new versions, price moves, rating shifts, and store copy.
List search, plain-text endpoints, multicolor bar charts, running totals on dashboard cells, plus reorder and image fixes. Search your sources, widgets, and dashboard: Search your data sources by name or address, a source's widgets by title or type, and your dashboard, which filters down to the matching widgets. Sort your data sources: Order the list by name, health, most recently updated, or date added. Your choice is remembered. Color bars by rule (Premium): Color each bar of a bar chart on its own, by its value (green above a target, red below) or by how it changed from the bar before it. Connect to plain-text endpoints: Read an endpoint that returns a bare value with no JSON or XML around it, like "72.5" or "active", straight into a widget. Running totals on dashboard cells: A trend or chart cell can show a running total and the latest value together, like the Chart widget. Pick Actual or Cumulative and turn on the total. A tidier List editor: Each fixed row now gets its own titled section with room to breathe, matching the dashboard editor. Clearer drag-to-reorder: The insertion line now shows on the correct side of the widget you drop onto. Better tinted and clear widgets: Image widgets show a tinted version of your photo instead of a solid color, and the map label, refresh button, and image captions stay legible instead of blending together. Tidier circular gauges: A long value and unit now stay inside the gauge ring instead of spilling across the circle.
Screenshots




About
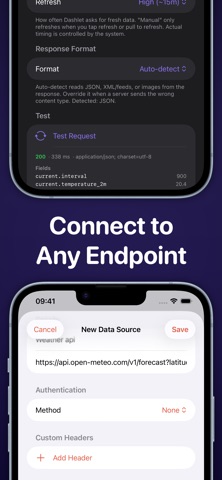
# Put any data on your Home Screen. Dashlet lets you build beautiful widgets from almost any online data source. Display weather, scenic webcams, Home Assistant sensors, RSS feeds, server dashboards, solar production, package tracking, satellite positions, and much more; all on your Home Screen, Lock Screen, and Apple Watch. No coding. No accounts. No cloud. # Connect almost anything • HTTPS endpoints • JSON, XML/RSS and images • Bearer tokens, Basic Authentication and custom headers • Secure Keychain storage # Build widgets visually Browse your response, pick the fields you want, and map them into widgets with an intuitive visual editor. No JSON paths or scripting required. # Multiple widget types • Value • Dashboard • List • Image • Image + Text • Carousel • Charts and Gauges • Maps # Designed for power users Perfect for: • Home Assistant • Scenic webcams • Photo feeds • Weather • Solar monitoring • Server monitoring • RSS feeds • Package tracking • Satellite tracking • Smart homes • Personal dashboards # Always available Dashlet caches your latest data so widgets continue working even when you're offline. # Know when something changes View request history, response times, success rates and endpoint health to quickly diagnose problems. ---- Terms of Service: https://getdashlet.app/terms Privacy Policy: https://getdashlet.app/privacy Terms of Use (Apple Standard EULA): https://www.apple.com/legal/internet-services/itunes/dev/stdeula/
What's new · 1.4
List search, plain-text endpoints, multicolor bar charts, running totals on dashboard cells, plus reorder and image fixes. Search your sources, widgets, and dashboard: Search your data sources by name or address, a source's widgets by title or type, and your dashboard, which filters down to the matching widgets. Sort your data sources: Order the list by name, health, most recently updated, or date added. Your choice is remembered. Color bars by rule (Premium): Color each bar of a bar chart on its own, by its value (green above a target, red below) or by how it changed from the bar before it. Connect to plain-text endpoints: Read an endpoint that returns a bare value with no JSON or XML around it, like "72.5" or "active", straight into a widget. Running totals on dashboard cells: A trend or chart cell can show a running total and the latest value together, like the Chart widget. Pick Actual or Cumulative and turn on the total. A tidier List editor: Each fixed row now gets its own titled section with room to breathe, matching the dashboard editor. Clearer drag-to-reorder: The insertion line now shows on the correct side of the widget you drop onto. Better tinted and clear widgets: Image widgets show a tinted version of your photo instead of a solid color, and the map label, refresh button, and image captions stay legible instead of blending together. Tidier circular gauges: A long value and unit now stay inside the gauge ring instead of spilling across the circle.
Details