

Multi Weather -Compare Models
QAEE CONPUUTENG, INC. · Weather
Independent analytics for this App Store listing. AppTracker is not affiliated with QAEE CONPUUTENG, INC.
Chart standing · US
What changed · US
Listing changes AppTracker has observed for this app in this storefront — new versions, price moves, rating shifts, and store copy.
• Times when a model finds no precipitation are now marked in the weather strip. • Weather symbols now come only from each agency's or model's own classification (ICON: clear to thunderstorm; ECMWF, GFS, GDPS: rain, snow and similar). • The note at the bottom of the screen now states that numerical model output is not a forecast and may contain large errors. • Axis numbers no longer overlap, and the collapsed legend shows that more items follow. • NWS is now drawn in purple, easier to tell apart from MET Norway. • Cloud cover readings are shown as whole numbers. • In the weather strip, hours without a symbol now show cloud cover as a filled dot (no sunny/cloudy classification). • GFS cloud cover is now shown. • Maximum and minimum labels on graphs now stay within the visible area.
Screenshots



About
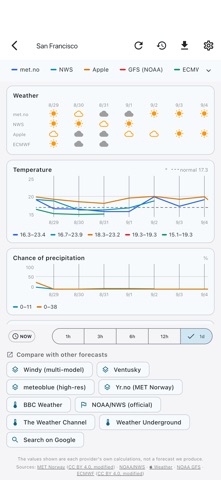
Multi Weather lines up official agency forecasts and numerical model output on one screen so you can spot where they disagree at a glance. Instead of trusting a single forecast, compare the official JMA forecast with the output of several models to make on-site Go/No-Go calls faster. ■ Official forecasts and model output together See official forecasts from JMA, MET Norway, Apple and NWS (US), alongside numerical model output from GFS, ECMWF, ICON and more — whichever are available for your location — overlaid on one timeline. Weather symbols (each agency's or model's own classification), precipitation (amount/probability), wind, temperature, cloud cover and humidity, side by side. Data sources: JMA, NOAA GFS, NWS (US), ECCC (Canada, GDPS), MET Norway, ECMWF (IFS, AIFS), ICON model (DWD), HARMONIE model (DMI), Apple Weather. ■ See the disagreement Every source is drawn on the same graph, so the hours where forecasts and model output split are visible at a glance. The way professionals read model differences — in seconds, for anyone. ■ Evidence export (CSV and PDF) Export the comparison as CSV or PDF to share. Hand a clear basis for a stop/postpone decision to clients or contractors. ■ Jump to other services Open JMA, tenki.jp, Yahoo Weather or Windy for the exact spot you're viewing, in an in-app window. ■ Built for the field For construction, civil works, ports, surveying, drones, film shoots, fishing and hiking — anything weather-dependent. Note: This app does not make its own forecast. It shows official agency forecasts (e.g. JMA) and numerical model output as provided, side by side. Numerical model output is not a forecast and may contain large errors. Final decisions are your responsibility. The first 30 days are completely free. To keep using all features afterward, an auto-renewing subscription (monthly or yearly) is required — cancel anytime. Terms of Use (EULA): https://www.apple.com/legal/internet-services/itunes/dev/stdeula/ Privacy Policy: https://qconp.com/privacy
What's new · 1.0.9
• Times when a model finds no precipitation are now marked in the weather strip. • Weather symbols now come only from each agency's or model's own classification (ICON: clear to thunderstorm; ECMWF, GFS, GDPS: rain, snow and similar). • The note at the bottom of the screen now states that numerical model output is not a forecast and may contain large errors. • Axis numbers no longer overlap, and the collapsed legend shows that more items follow. • NWS is now drawn in purple, easier to tell apart from MET Norway. • Cloud cover readings are shown as whole numbers. • In the weather strip, hours without a symbol now show cloud cover as a filled dot (no sunny/cloudy classification). • GFS cloud cover is now shown. • Maximum and minimum labels on graphs now stay within the visible area.
Details