

Clima Viva
Walter Tengler · Weather
Independent analytics for this App Store listing. AppTracker is not affiliated with Walter Tengler.
Chart standing · US
What changed · US
Listing changes AppTracker has observed for this app in this storefront — new versions, price moves, rating shifts, and store copy.
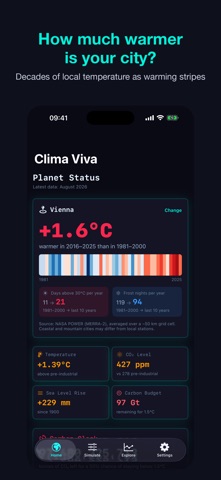
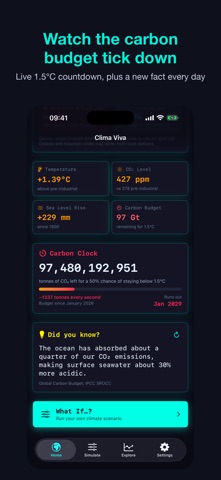
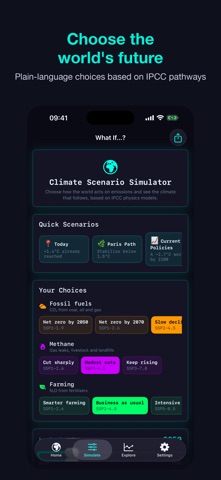
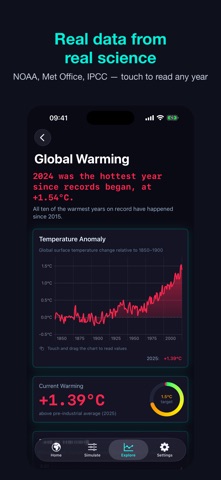
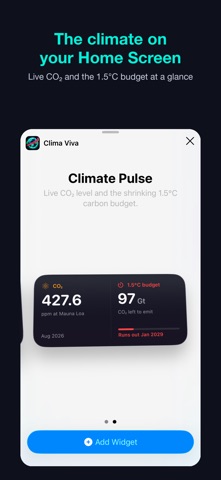
What's New in Clima Viva 2.0 • Your City: see how much warmer your city has become since 1981 — with warming stripes, hot days and frost nights. • Real, cited data: CO₂, methane, N₂O and temperature from NOAA, the Met Office and the IPCC, updated to 2026. • A smarter simulator: choose how the world acts on fossil fuels, methane and farming, and watch warming unfold year by year against the IPCC pathways. • Live Carbon Clock: the remaining 1.5°C budget, ticking down every second. • New home-screen and lock-screen widget: latest CO₂ and the shrinking carbon budget. • Daily climate fact and optional alerts when CO₂ hits a new record. • Simpler navigation with four tabs, clearer charts you can touch to read, and better accessibility and translations.
In-app purchases · US
No in-app purchases.
Screenshots


About
Here's a fresh App Store description built around the new Dashboard and Climate Simulator: Clima Viva — Climate Data & "What If?" Simulator See where our planet stands today, and explore what tomorrow could look like. Clima Viva turns the latest climate science into an interactive experience you can actually feel. A living dashboard of Earth's vital signs Open the app and see the planet's pulse at a glance: current temperature anomaly, atmospheric CO₂, sea-level rise, and the remaining 1.5°C carbon budget — all pulled from authoritative sources (NASA GISS, NOAA, Mauna Loa, IPCC AR6) and updated with every release. The "What If…?" Climate Simulator This is the heart of the app. Drag four sliders — CO₂, CH₄ (methane), N₂O (nitrous oxide), and a target year up to 2150 — and watch Earth respond in real time. Under the hood is a full climate math engine built on peer-reviewed science, not marketing: Radiative forcing — Myhre et al. (1998), IPCC AR4/AR5 Temperature response — IPCC AR6 Equilibrium Climate Sensitivity (3.0°C per CO₂ doubling), anchored to the observed 2025 state Sea-level rise — Rahmstorf (2007) semi-empirical model Wildfire danger — Abatzoglou & Williams (2016) Storm intensity — Emanuel (2005), Knutson et al. (2020) Arctic sea ice — Notz & Stroeve (2016) Coral bleaching — IPCC SR1.5 (2018) Every number is sourced. Tap "Scientific Basis" in the simulator to see exactly which paper produced which result. Six impact cards, now with live visuals Each of the six impact dimensions comes with its own animated graphic so you don't just read the numbers — you see them move: A semicircle thermometer gauge rising through green, orange, red A rising water-fill bar for sea level A horizontal flame bar for wildfire danger A 270° speedometer arc for storm intensity Two area-proportional circles comparing Arctic ice in 1990 vs your scenario A coral-pink-to-bleached-white gradient showing reef stress Planetary Health bar A single composite score combining all six impacts into one easy-to-read gauge — Stable, Stressed, Critical, or Collapsing — with a floating needle that moves as you drag the sliders. Scenario trajectory chart A Swift Charts line chart projects your scenario's temperature path from 2025 to your chosen target year, overlaid with the current-policies baseline and the 1.5°C and 2°C Paris Agreement reference lines. Deep-dive data views Beyond the simulator, explore the full historical record: Global temperature anomalies since 1880 CO₂, CH₄ and N₂O concentrations with contextual annotations Climate progress tracker — are we on track for 1.5°C? Designed for everyone, everywhere Fully localized into 11 languages: English, German, Spanish, French, Italian, Japanese, Korean, Dutch, Polish, Portuguese, and Simplified Chinese Light and dark themes tuned for data readability Built natively with SwiftUI and Swift Charts for a smooth, modern iOS feel No ads, no trackers, no account required Clima Viva makes climate science tangible. Pull a slider, watch a coral reef bleach or recover, and understand — in your hand — what "1.5°C" and "2°C" actually mean for the world we live in.
What's new · 2
What's New in Clima Viva 2.0 • Your City: see how much warmer your city has become since 1981 — with warming stripes, hot days and frost nights. • Real, cited data: CO₂, methane, N₂O and temperature from NOAA, the Met Office and the IPCC, updated to 2026. • A smarter simulator: choose how the world acts on fossil fuels, methane and farming, and watch warming unfold year by year against the IPCC pathways. • Live Carbon Clock: the remaining 1.5°C budget, ticking down every second. • New home-screen and lock-screen widget: latest CO₂ and the shrinking carbon budget. • Daily climate fact and optional alerts when CO₂ hits a new record. • Simpler navigation with four tabs, clearer charts you can touch to read, and better accessibility and translations.
Details