
Chart standing · US
Screenshots



About
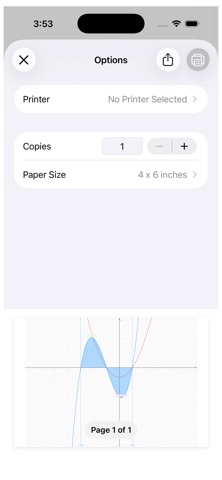
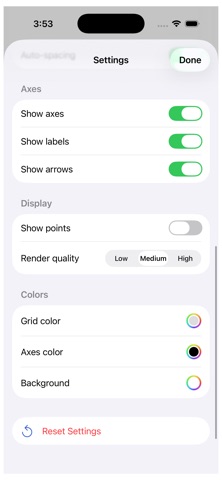
GT Graph transforms your device into a powerful mathematical visualization tool. Plot equations, explore calculus concepts, and bring mathematics to life with stunning interactive graphs. PLOT ANY EQUATION - Cartesian functions - Polar curves - Parametric equations - Implicit equations - Inequalities with shaded regions INTUITIVE INPUT Type equations naturally with implicit multiplication support. Write 2x instead of 2*x, or 2sin(x) instead of 2*sin(x). GT Graph understands mathematical notation the way you write it. COMPREHENSIVE FUNCTION LIBRARY - Trigonometric: sin, cos, tan, sec, csc, cot - Inverse trigonometric: asin, acos, atan - Hyperbolic: sinh, cosh, tanh - Exponential and logarithmic: exp, ln, log, log2 - Power functions: sqrt, cbrt, abs - Constants: pi, e, phi (golden ratio) MULTIPLE GRID TYPES - Standard Cartesian grid - Trigonometric grid with pi-labeled axes - Polar coordinate grid with radial lines - Logarithmic scale grid CALCULUS TOOLS - Calculate derivatives at any point - Compute definite integrals with visual shading - Find zeros (roots) of functions - Locate local minima and maxima - Generate value tables INTERACTIVE EXPLORATION - Pinch to zoom, drag to pan - Tap to show tangent lines - Crosshair cursor displays coordinates - Plot multiple equations simultaneously - Color-coded graphs for easy identification SAVE AND SHARE - Save your work as .gtgraph files - Export and share with colleagues - Equation history saves your last 25 entries - Settings persist between sessions Perfect for: - Students learning algebra, trigonometry, and calculus - Teachers creating visual demonstrations - Engineers and scientists visualizing data - Anyone curious about mathematical beauty GT Graph combines the power of professional graphing software with the elegance of modern design. Start plotting today!
What's new · 1.1.0
- Added 3D function plotting - Bug fixes and stability improvements
Details