

DataJot
Arthur BABEY · Productivity
Independent analytics for this App Store listing. AppTracker is not affiliated with Arthur BABEY.
Chart standing · US
What changed · US
Listing changes AppTracker has observed for this app in this storefront — new versions, price moves, rating shifts, and store copy.
DataJot 1.5.1 adds Spanish and brings several improvements: - Use DataJot in Spanish across the app, widgets, Shortcuts, and accessibility text. - Enter measurements more naturally: the value field no longer starts with a zero. - Enjoy clearer spacing between period navigation and other actions on iPad and Mac.
Ratings breakdown · US
The star breakdown behind this app's rating in this storefront.
In-app purchases · US
No in-app purchases.
Screenshots


Keywords this app targets
Search terms AppTracker associates with this app — estimates, not search volume. ❝ = in the app's title; a highlighted number is its current position for that term.
Similar apps
Competitors and close alternatives, as estimated by AppTracker.
 HabitTap Daily Tracker
SHOTA MIYAHIRA
2 shared topics
HabitTap Daily Tracker
SHOTA MIYAHIRA
2 shared topics
 Simple Tracker: Goals
Michael Neal
2 shared topics
Simple Tracker: Goals
Michael Neal
2 shared topics
 Quick Event Logger
Yogesh Buradkar
2 shared topics
Quick Event Logger
Yogesh Buradkar
2 shared topics
 SmartDiet: Weight Loss Watcher
Komorebi Inc.
SmartDiet: Weight Loss Watcher
Komorebi Inc.
 Habit Tracker
InnerGrow
1 shared topic
Habit Tracker
InnerGrow
1 shared topic
 Body Measurement - Measure Up
Interapptive Pty Ltd
Body Measurement - Measure Up
Interapptive Pty Ltd
 Calendar Jot
Takaaki Onishi
1 shared topic
Calendar Jot
Takaaki Onishi
1 shared topic
 Trackly +
Tan Chia Ling
Trackly +
Tan Chia Ling
About
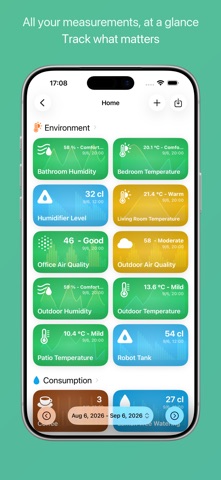
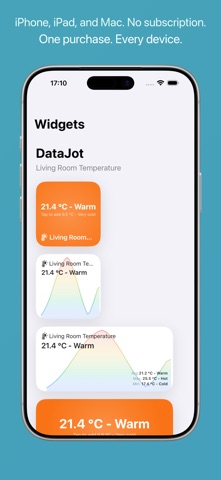
DataJot is the simple, private app for tracking the measurements that matter to you. Room temperature, humidity, consumption, budget, workouts, sleep, mood, coffee, counters, routines, or small personal experiments: DataJot helps you record values over time, then turn them into clear trends without opening a spreadsheet for every tracker. Create a series, choose a unit, add measurements in seconds, and let DataJot build a readable view of what is really changing. You stay in control: each tracker can remain simple or become more precise with statistics, thresholds, colors, and custom charts. Flexible tracking, built around your own use cases DataJot does not force a method on you. Create the series you need, organize them with categories, and use ready-made templates to get started faster. Personal measurements, habits, home sensor readings, recurring quantities, or productivity indicators: you decide what is worth observing. Charts that make your data useful View your values as line, area, bar, or point charts. Check changes across different ranges, from day to year, then move through time by scrolling the chart or using the period navigator. Adjust the display, choose visible statistics, and more easily spot variations, averages, extremes, or cumulative totals. When a single value is not enough, add custom thresholds with labels, colors, and axis bounds. DataJot can also show the distribution of your measurements by threshold, helping you understand how much of your data falls into each zone. Import and export across your series Import or export measurements from multiple series in a single CSV operation. Move your data or continue analyzing it with your own tools without repeating the same action for every series. Made for the Apple ecosystem Quickly add a measurement from a widget, view recent charts, and use the Shortcuts app to create series, add values, export data, or fetch your latest aggregates. On Mac, an optional local HTTP server also lets you add or fetch measurements from your own tools. Your data, your rhythm DataJot works without ads and without subscriptions. One purchase gives you the app on iPhone, iPad, and Mac. iCloud sync can keep your trackers available across your Apple devices while keeping your data under your control. DataJot is made for people who want to understand their numbers without complexity: record what happens, see what changes, and build a clear memory of their personal measurements over time.
What's new · 1.5.1
DataJot 1.5.1 adds Spanish and brings several improvements: - Use DataJot in Spanish across the app, widgets, Shortcuts, and accessibility text. - Enter measurements more naturally: the value field no longer starts with a zero. - Enjoy clearer spacing between period navigation and other actions on iPad and Mac.
Details