

Nuclear Power Plants - Atomkraft
Michael Hoereth · Education
Independent analytics for this App Store listing. AppTracker is not affiliated with Michael Hoereth.
Chart standing · US
In-app purchases · US
What this app sells inside itself, grouped by kind and priced for this storefront.
Screenshots
About
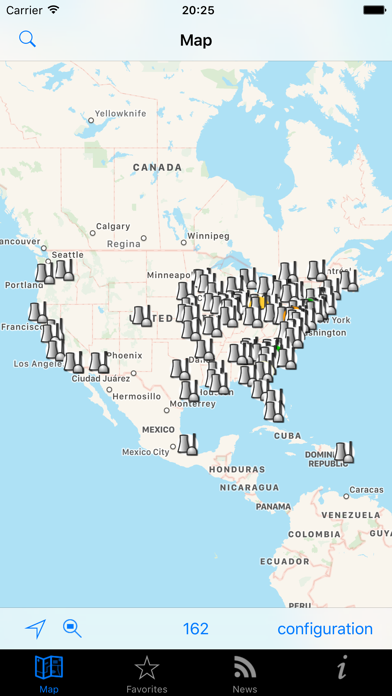
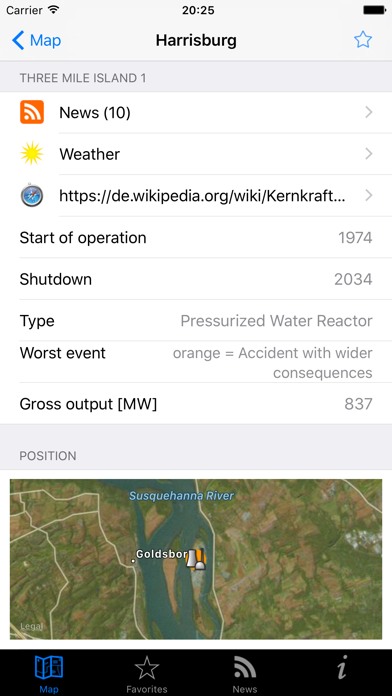
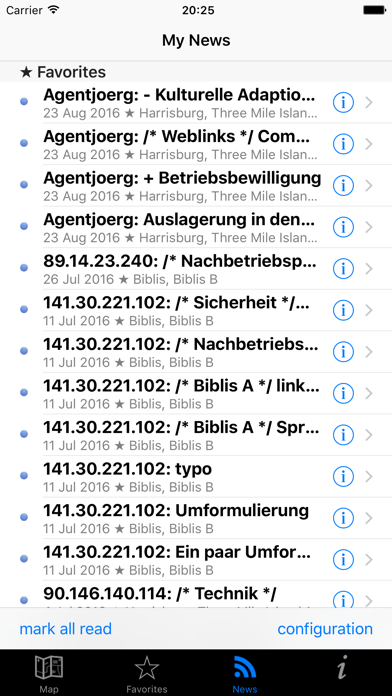
Check out this ad-free map of nuclear power plants worldwide and get an idea of how many there are already. The following arithmetic made me create this app: Scientists keep claiming that a worst-case scenario will happen only every 10,000 years. Sounds acceptable? It is an estimate for one nuclear power plant - but there are about 400 worldwide. Fukushima could have been anticipated by doing this calculation: 1986 + (10,000 / 400) = 2011. Who can say now it has been unpredictable? Accidents that were classified on the INES scale appear as colored circles. White = no events; up to dark red = catastrophy. Each location provides information about • start of operation, year of planned shutdown • gross output • in-depth information on mobile wikipedia page • news (wikipedia page history) • overview of recent wikipedia changes • worst recorded event (INES scale) • type of reactor • circle with configurable radius can be drawn around each plant Thanks to Chris, CCM and especially my brother Ralf for helping me compiling the data.
What's new · 2.8
This update from Apple will improve the functionality of this app. No new features are included. iOS 10 Bugfix
Details