

pollen.ny
Sabri Sonmez · Weather
Independent analytics for this App Store listing. AppTracker is not affiliated with Sabri Sonmez.
Chart standing · US
Ratings breakdown · US
The star breakdown behind this app's rating in this storefront.
In-app purchases · US
No in-app purchases.
Screenshots


About
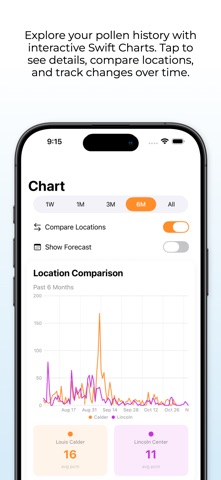
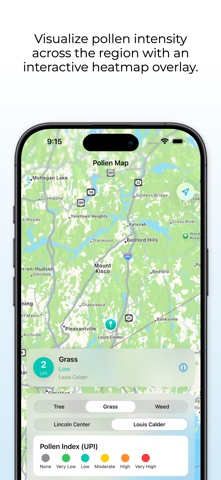
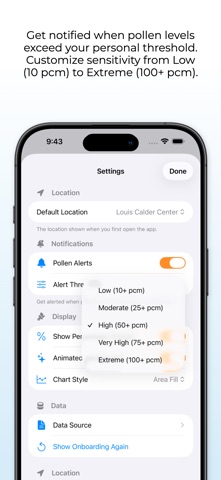
Pollen.ny helps you track pollen in and around New York City using real research data and live forecast signals. Follow daily pollen counts from Fordham University’s two monitoring sites, explore seasonal trends, and compare local observations with forecast data in a clear, interactive interface. Features: - Fordham Research Data Daily pollen counts from Louis Calder Center (Armonk) and Lincoln Center (NYC), including type breakdowns. - Google Forecast Integration Multi-day pollen outlook for Tree, Grass, and Weed categories. - Interactive Heatmap Explore regional pollen intensity with map overlays and location markers. - Historical Trends Visualize patterns over time with interactive charts and year-over-year comparisons. - Smart Alerts Set personal thresholds and get notified when pollen levels rise. - Data Source Comparison Compare observed counts and forecast signals to better understand current conditions. - Built for clarity Designed for students, researchers, and allergy-conscious New Yorkers who want a cleaner way to explore pollen data. Data sources Fordham University pollen monitoring data (student-collected and analyzed) Google Pollen API forecast data
What's new · 5.5
Pollen NY is now faster, clearer, and more efficient. Added smarter forecast caching to reduce repeated API requests Improved My Area forecast behavior with better location-based reuse Made the demo heatmap the default for a more reliable map experience Limited live heatmap behavior in public builds to keep usage predictable Cleaned up forecast architecture and naming across the app Improved forecast labels and consistency throughout the interface Refined the map, forecast, and chart experience for a smoother release
Details