

Taculator 84 Graphing Calc
Di Venisco UG (haftungsbeschrankt) · Education
Independent analytics for this App Store listing. AppTracker is not affiliated with Di Venisco UG (haftungsbeschrankt).
Chart standing · US
What changed · US
Listing changes AppTracker has observed for this app in this storefront — new versions, price moves, rating shifts, and store copy.
EASIER TO READ • Division now shows as a slash: 3/4 instead of 3÷4. You see it in the entry line, the history, Y=, tables, lists, matrices and programs, clearly apart from the plus sign • The fraction template keeps its stacked form, and the ÷ key stays where it is STATISTICS • QuadReg, CubicReg and QuartReg stay precise when your x values are far from zero, for example years such as 2015 to 2026 SMALL THINGS • With the status line on, tap the graph mode (PAR, POL or SEQ) to change it right there • Stability improvements throughout
Ratings breakdown · US
The star breakdown behind this app's rating in this storefront.
In-app purchases · US
What this app sells inside itself, grouped by kind and priced for this storefront.
Screenshots




About
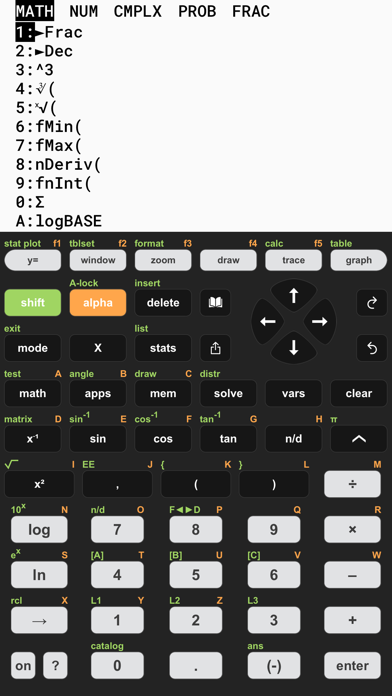
TACULATOR 84 GRAPHING CALCULATOR • Your graphing calculator for high school and college students. • All the commands you know: advanced math, lists, statistics, distributions, stat plots and more. • Covers everything you need: Pre-Algebra, Algebra 1 & 2, Pre-Calculus, Calculus, Statistics... IT'S EVEN BETTER THAN AN ACTUAL CALCULATOR • 100X faster than a handheld, using the full calculation power of your iPhone/iPad. • High-resolution graphing window for sharp and beautiful graphs. • Icon home screen, redesigned menus, optional status line. • Share calculations by text or email. ◉ Math Functions • Scientific calculator with every basic and advanced function. • Scrollable history; copy any previous calculation. • Complex numbers support • Probability: nPr, nCr, factorial, random numbers. • Enter fractions easily; tap any result to flip fraction and decimal. • Piecewise functions, sequences, list commands like seq(, ΔList(, augment(. • Degree, radian and gradian angle modes, DMS format. • Error messages point at the exact spot in your input. ◉ Graphing Functions • Four graphing modes: Function, Parametric, Polar and Sequence (u, v, w with TIME and WEB plots); trace, tables, CALC and zoom work in every mode. • Smart trace snaps to zeros, maxima, minima, intersections and asymptotes. • Calculate intersection, zero, minimum, maximum, integral, and derivative. • Full ZOOM menu: ZBox, ZSquare, ZTrig, ZoomFit, zoom factors and zoom memory. • Draw on your graph: text, pen, points, tangents, circles and shading in color. • Store and recall pictures, or put a photo behind your graph. • Graph statistical plots like histogram, box plot, scatter plot, xy-line plot. • Full-screen mode, pinch to zoom, full window and format settings. ◉ List, Statistics, and Distribution • Stat list editor with 1- and 2-Variable statistics. • Guided input wizards for every test, interval and distribution. • List math: min, max, mean, median, sum, product, standard deviation, variance. • Find best-fit regressions: LinReg (ax+b), LinReg (a+bx), QuadReg, CubicReg, QuartReg, LnReg, ExpReg, PwrReg, Logistic, SinReg, PropReg, RecipReg, eBASEReg — with r and r² diagnostics. • Manual-Fit a line by eye, or QuickPlot points and fit a model right on the graph. • Statistical tests: Z-Test, T-Test, 2-Sample Z- and T-Tests, 1- and 2-PropZTest, plus Z-, T- and proportion intervals. • Distributions: Normal, T, χ2, F, Poisson, Binomial, Geometric (each pdf and cdf), invT — and shade them right on the graph. ◉ Command Catalog & Syntax Help • Integrated Catalog & Help: syntax, examples and error messages for every command. • Type a command and see the right syntax next to the cursor. ◉ Built-in Apps • Geometry: points, lines, circles and polygons — measure, transform, animate. • Polynomial Root Finder & Simultaneous Equation Solver. • Finance: Time-Value-of-Money solver, NPV, IRR, amortization. • Probability Simulation: toss coins, roll dice, spin spinners, draw cards. • Science Tools: sig-fig calculator, unit converter, data/graphs wizard, vector calculator. • Conics & Lines: equation templates for lines (even X=C), circles, parabolas, ellipses and hyperbolas, with SOLVE for center, foci, vertices, directrix. • Transformation Graphing, Inequality Graphing, Periodic Table. • Numeric Solver: solve any equation for any variable. ◉ Matrix Calculator • Store matrices and reuse them as [A], [B], [C], ... • Matrix arithmetic: addition, multiplication, scalar products, powers. • Transpose, determinant, inverse, dimension, ref/rref, identity matrix, cumulative sum. SUPPORT Contact us at contact@taculator.com --- Taculator Pro Membership • Unlock advanced calculations and functions with a monthly, yearly, or lifetime subscription. • Subscriptions auto-renew unless canceled at least 24 hours before the end of the current period. • Manage subscriptions in Account Settings. Terms of Service: https://taculator.com/terms/ Privacy Policy: https://taculator.com/privacy/
What's new · 2.2.1
EASIER TO READ • Division now shows as a slash: 3/4 instead of 3÷4. You see it in the entry line, the history, Y=, tables, lists, matrices and programs, clearly apart from the plus sign • The fraction template keeps its stacked form, and the ÷ key stays where it is STATISTICS • QuadReg, CubicReg and QuartReg stay precise when your x values are far from zero, for example years such as 2015 to 2026 SMALL THINGS • With the status line on, tap the graph mode (PAR, POL or SEQ) to change it right there • Stability improvements throughout
Details