

HI Buoy
ONOSOL LLC · Sports
Independent analytics for this App Store listing. AppTracker is not affiliated with ONOSOL LLC.
Chart standing · US
What changed · US
Listing changes AppTracker has observed for this app in this storefront — new versions, price moves, rating shifts, and store copy.
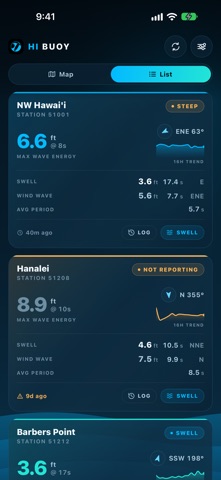
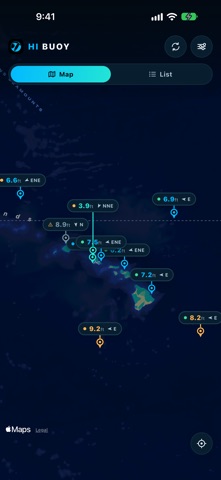
HI Buoy has been rebuilt from the ground up. • A new map of every buoy around the islands, framed to fit your screen • Swell Power chart with touch-and-drag readings • Swell and wind wave shown separately, with a 16-hour trend on every buoy • Buoys that stop reporting are clearly marked • Works in portrait and landscape, on phones and tablets
Price & rating history · US
Reconstructed from the listing changes AppTracker has observed in this storefront. A field is charted once it has changed more than once, and each line starts at the value it moved from.
Average rating · ★ 4.00 now · 2 changes on record
Ratings breakdown · US
The star breakdown behind this app's rating in this storefront.
In-app purchases · US
No in-app purchases.
Screenshots


About
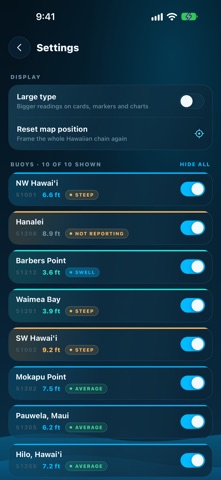
Paddle out knowing what's out. Every wave buoy in the Hawaiian chain, in one place, reporting what the ocean is actually doing. HI Buoy reads live from the NOAA National Data Buoy Center stations moored around the islands — Waimea Bay, Barbers Point, Mokapu Point, Hanalei, Pauwela, Hilo, and the deep-water stations far offshore — and shows you the numbers straight. This is measured data, not a forecast. Every figure came off a buoy in the water. THE WHOLE CHAIN AT A GLANCE Open the map and every buoy carries its current wave height and swell direction, color-coded so a big day stands out before you read a single number. Tap any buoy for the full picture. THE NUMBERS THAT MATTER Wave height, dominant period, average period and dominant direction, plus the swell and wind-wave trains broken out separately with their own height, period and direction. A steepness reading tells you whether it's clean groundswell or short, wind-driven chop. SWELL POWER A height reading alone won't tell you whether a swell is filling in or fading. HI Buoy charts sixteen hours of hourly spectral energy so you can see the trend, with the raw frequency spectra underneath. Touch and drag to inspect any hour. RECENT LOG The last sixteen hourly observations laid out in full — height, period, direction, swell and wind wave — so you can read the shift for yourself. HONEST WHEN A BUOY GOES QUIET Buoys break down, drift, and get pulled for maintenance. When one stops reporting, HI Buoy says so plainly instead of leaving an old number on screen looking current. BUILT FOR THE ISLANDS All times in Hawaii Standard Time, no converting in your head. Choose which buoys you want to see and hide the rest. A large-type setting for reading at arm's length. Designed for iPhone and iPad, in portrait and landscape.
What's new · 2.3
HI Buoy has been rebuilt from the ground up. • A new map of every buoy around the islands, framed to fit your screen • Swell Power chart with touch-and-drag readings • Swell and wind wave shown separately, with a 16-hour trend on every buoy • Buoys that stop reporting are clearly marked • Works in portrait and landscape, on phones and tablets
Details