

Chart & Graph Maker - GraPho
AppSeed, Incorporated. · Entertainment
Independent analytics for this App Store listing. AppTracker is not affiliated with AppSeed, Incorporated.
Chart standing · US
What changed · US
Listing changes AppTracker has observed for this app in this storefront — new versions, price moves, rating shifts, and store copy.
• Added decimal display settings. Show values and percentages automatically or with 0–4 decimal places. • View statistics for your data, including count, sum, average, minimum, and maximum. • Added landscape (16:9) image export for Premium. Save and share graphs in a format suited to reports and presentations. • Improved numeric and histogram input handling, and fixed display issues with graph labels and the purchase screen.
Ratings breakdown · US
The star breakdown behind this app's rating in this storefront.
In-app purchases · US
What this app sells inside itself, grouped by kind and priced for this storefront.
Screenshots



About
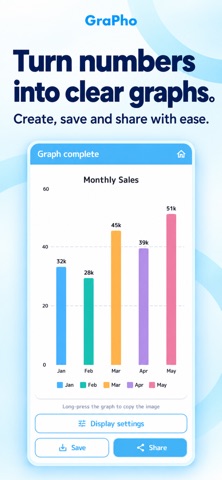
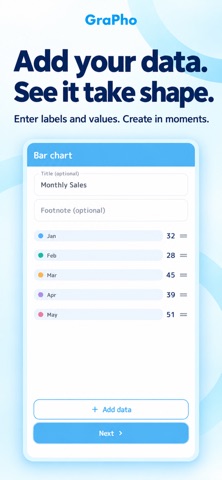
Make a pie chart for survey results, a bar graph to compare values or a line chart to show change over time. GraPho is a simple chart and graph maker that turns your labels and numbers into clear images for school reports, presentations and everyday data sharing. CHOOSE THE RIGHT GRAPH Pie charts: show percentages and proportions at a glance. Turn poll results or category totals into a visual breakdown. Bar charts: compare sales figures, experiment results or counts across categories. Make differences easier to explain in your next report. Line charts: display trends in measurements or monthly data. Help your audience see how values change over time. Horizontal bar charts and histograms are also available with Premium. Use a histogram to visualize a frequency distribution or choose horizontal bars to compare categories. SAVE GRAPH IMAGES FOR YOUR REPORTS Export high-resolution images to illustrate homework, share survey findings or add charts to presentation slides. Turn a table of figures into a picture your audience can understand. KEEP YOUR DATA USEFUL Adjust data colors, revisit saved graphs, edit earlier entries and back up or restore your work. Graph creation works offline, so you can prepare visuals without an internet connection. START WITH THREE STEPS 1. Select a graph type. 2. Enter labels and numerical values. 3. Save the finished chart as an image. Use the built-in guide when you need help getting started. PREMIUM OPTIONS Core features are free. Premium adds ad removal, unlimited pie-chart data points, seven theme colors, horizontal bar charts, histograms, and image backgrounds that are transparent or use a custom color. Monthly and yearly subscriptions are available. The separate one-time purchase removes ads only; it does not unlock all Premium features. Subscriptions are billed to your Apple ID when you confirm a purchase. Renewal is automatic unless disabled at least 24 hours before the current period ends. Manage or cancel your subscription in your App Store account settings. From survey percentages to changes in your latest measurements, make your data easier to explain with GraPho.
What's new · 2.12.0
• Added decimal display settings. Show values and percentages automatically or with 0–4 decimal places. • View statistics for your data, including count, sum, average, minimum, and maximum. • Added landscape (16:9) image export for Premium. Save and share graphs in a format suited to reports and presentations. • Improved numeric and histogram input handling, and fixed display issues with graph labels and the purchase screen.
Details